At RemoteWinBox, we love LibreNMS
One thing I find all too often is a lack of monitoring the health of equipment. From servers to switches and radios to routers, part of a good operational plan is to pay attention to the health of your systems. There’s tons of options in this space and one of our favorites is LibreNMS because it’s available for free, it’s relatively easy to install and there’s good documentation. In addition, it’s very full-featured and well automated for the price!
What do we like about LibreNMS?
Dashboard
Build your own dashboard allows for a quick heads-up of health information. We like to keep an eye on each of our top services equipment.
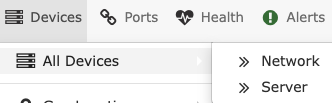
Auto Discovery
One of the great things about LibreNMS is that it can fingerprint the operating system of a device and automatically organizes and collects appropriate data for different things it’s connected to – so for example we use this instance of LibreNMS for watching servers and network gear, and it just knows which is which without us having to do any work.
Alerting
This one can take some effort to customize if you want to be push notified and have, for example, a Slack message pop up when something goes awry. But it’s worth it to have some awareness and as we mentioned in the intro, documentation is good and the platform is very flexible with support for tons of 3rd party integrations. So when we decided to add Slack messages for LibreNMS alerts, we just looked it up in the documentation here and followed the directions. If you take a look, you’ll see there’s a rich amount of “Transports”, or plugins that you can enable in Libre to have it Alert other platforms that something is up.
Price
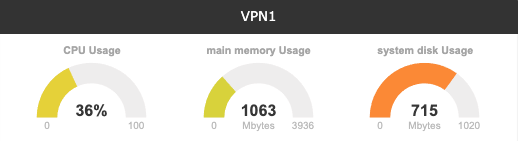
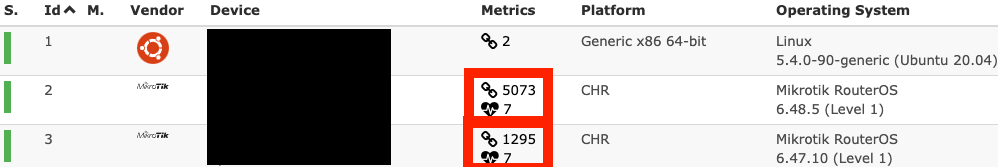
We mentioned that LibreNMS is free, but here’s an idea of the value. If you look at just a couple of these monitored hosts, some of them have THOUSANDS of metrics, or what other monitoring solutions calls sensors or aspects. With a paid NMS, you’ll typically pay per metric measured, not per host. In this cropped screenshot, we’re only showing a couple of devices (hosts), but some of them have loads of measurements collected. With just what’s seen here, many paid NMS would charge over $10,000!!! What a savings!
And note, vendor, OS and platform was auto-discovered!
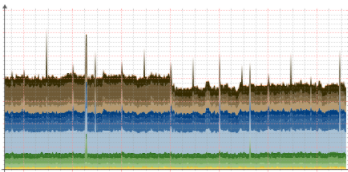
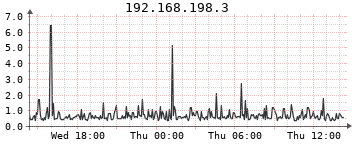
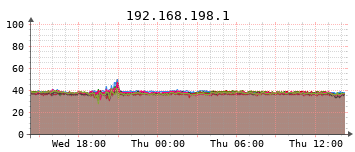
Graphs
One of the best features of any NMS, Libre included, is the ability to look at historical graphs. Being able to see the health of network stats, CPU, RAM, Disk, Uptime, latency, etc. and check on it today compared to yesterday, last week, or last month is incredibly powerful.
Awesome! How can I power up my monitoring with LibreNMS?
You can spin up your own LibreNMS by doing what we do and following the official documentation here: https://docs.librenms.org/Installation/Install-LibreNMS/. You can run it on a single server or you can separate out the functions for better scale by using a dedicated database for example, or adding caching services.
Some of RemoteWinBox Admiral customers have engaged our professional services to setup and maintain LibreNMS on their appliance.
Related Posts